Operation Monitoring
Operation Monitoring includes dashboards that monitor application performance and overall system performance.
The dashboards include:
- Alert Dashboard
The Alert Dashboard provides a list of alerts triggered in CMP
 Converged Monetisation Platform. The MDS Global product that supports customer care and billing for digital service providers..
From the Alert Dashboard screen, you can:
-
Silence alerts. Select the Silence button to temporarily suppress alert notifications and prevent alert notifications from being sent. The Silence button is enabled for alerts that are currently firing. These alerts will remain silenced for a configured period of time.
-
Unsilence alerts. Select the Unsilence button to resume alert notifications. This button is enabled for alerts that have been silenced.
-
CMP REST
Representational State Transfer. An architectural style that specifies constraints, such as the uniform interface, that if applied to a web service results in performance, scalability, and modifiability, optimising services to work on the Internet. API Application Programming Interface. A set of functions and procedures that allow the creation of applications that access the features or data of another software system, such as an application or operating system. Dashboard - Tracks application performance, including component availability, response times, throughput, and error rates. 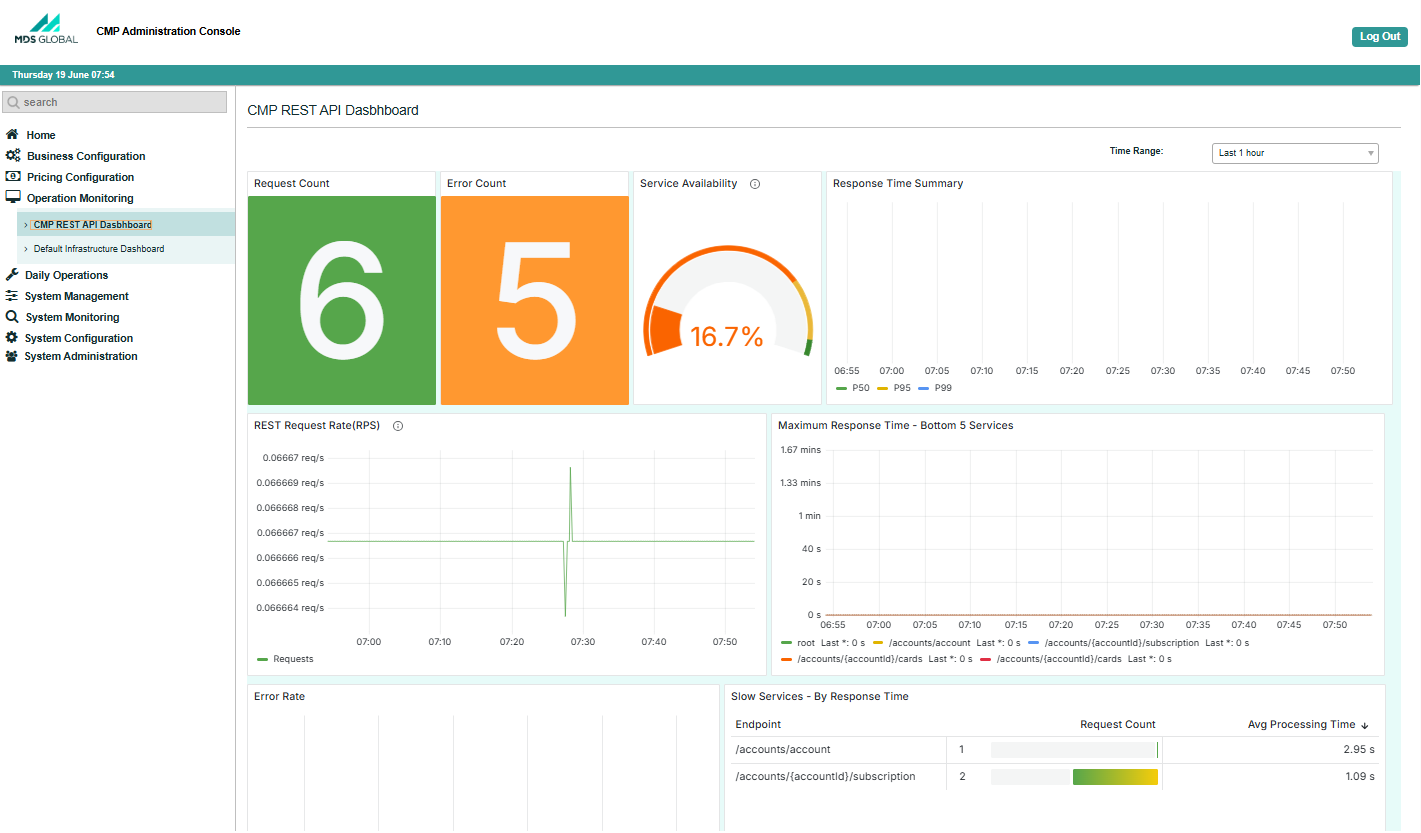
REST API Dashboard
It includes:
API request and response volumes, to understand usage
The consumption of services, for example a subscriber using call minutes. patterns and detect surges or drops in traffic.Response times, which measures how quickly APIs return data, including average, P95, and P99 latency.
Error rates and status codes, to identify issues such as failed authentications, timeouts, or server errors.
Throughput and Availability, which tracks whether APIs are reachable and functioning.
-
Default Infrastructure Dashboard - Monitors overall system performance, including CPU usage, total RAM used, and server uptime (the amount of time a server has been running and available without interruption).
This dashboard includes:
-
CPU and memory usage, helping ensure sufficient processing power and system stability.
-
Disk space, to detect storage limitations and bottlenecks.
-
Network
In the context of CMP, the infrastructure on which usage of registered customers will be measured – this could be a mobile phone network, broadband network or other non-telecommunications network. activity, which monitors traffic in and out of servers for possible congestion or anomalies.
-
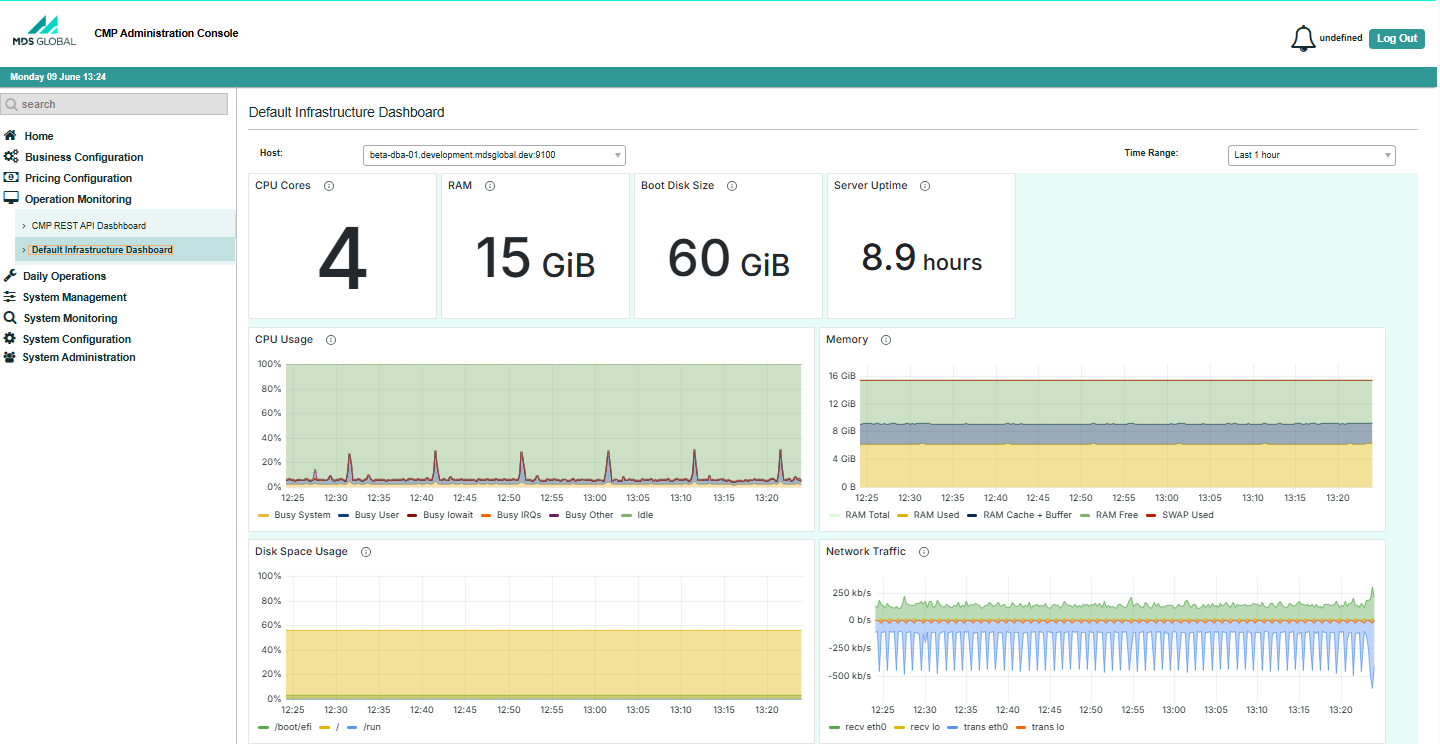
Default Infrastructure Dashboard